|
Announcing
the development of a state of the art ship for autonomous hydrographic surveys
356 days a year*, year in year out.
The
compact 'Mosquito' ship measures 42.8
meters (139ft) x 16.4meters (53.3ft) and is constructed of 5383
sealium alloy which is virtually maintenance free.
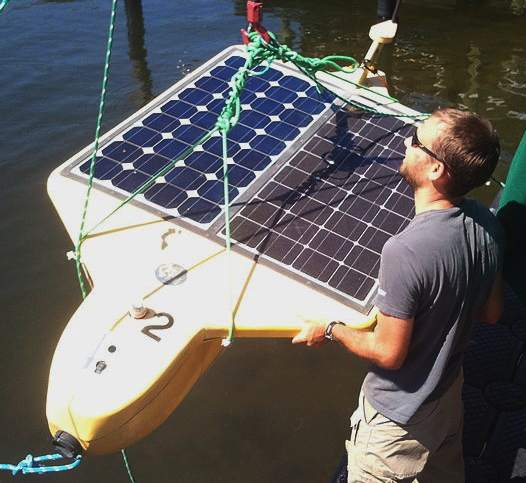
The design includes solar arrays and wind generators to power the craft at
between 7-10 knots continuously, and provide energy
for comprehensive onboard navionics and sensing electronics. Subject to funding,
a consortium of developers aim to plan construction of a prototype vessel
from as early as June of 2013.
SPECIFIC
MARKET (& MILITARY) APPLICATIONS -
• Seismic research
• Offshore, near shore and coastal construction
• Dredging
• Cable laying
• Governmental, river and port authority activities
• Positioning of Oil rigs
• Laying and charting of Pipelines
• Dredging of fairways and harbours
• Land and beach reclamation
• Construction of bridges and tunnels
• Searching for wrecks / obstacles
• Processing / Drawing of charts
• Route / Site surveys |
|
•
Intelligence, Surveillance, Reconnaissance
•
Mine Countermeasures
•
Expeditionary Warfare
•
Tactical Oceanography
•
Explosive Ordnance Disposal
•
Anti pirate patrols
|
|
|
|
EXPLORATION
- Oil exploration companies are increasingly turning to robot ships to remain competitive.
Now seen as essential tools of the trade, robots
help
humans to do things better and quicker. The time is now to develop a
practical blue water high endurance robot system for hydrographic surveys as the next stage of marine
evolution.
OVERHEADS
- Autonomous surveys are cost effective. The extra cost of the autonomous
system is offset in the long term by near continuous operations without a
crew to feed and keep warm or cool. Operations may be conducted from shore
based offices within existing corporate premises. Solar power practically
eliminates diesel fuel bills, saving between
£400,000 - 800,000 in ten years. In the same ten years an operator will
save minimum manning costs of £1,200,000. That's a $2m saving in ten
years; £4m in twenty years, with a 30 year design life*. A gift of £6m
($ 9.52m) (E7.15m)
to you from nature.
HYDROGRAPHY
- Hydrography refers to the mapping or charting of water's topographic features. It involves measuring the depths, tides, and currents of a body of water and establishing the topography and morphology of seas, rivers, and lake beds. Normally and historically the purpose of charting a body of water is for the safety of shipping navigation. Such charting includes the positioning and identification of things such as wrecks, reefs, structures (platforms etc.), navigational lights, marks and buoys and coastline characteristics.
OVERVIEW - Large-scale hydrography is usually undertaken by national or international organizations which sponsor data collection through precise surveys and publish charts and descriptive material for navigational purposes. The science of oceanography is, in part, an outgrowth of classical hydrography. In many respects the data are interchangeable, but marine hydrographic data will be particularly directed toward marine
navigation and safety of that navigation. Marine resource exploration and exploitation is a significant application of hydrography, principally focused on the search for hydrocarbons.
Hydrographical measurements include the tidal, current and wave information of physical oceanography. They include bottom measurements, with particular emphasis on those marine geographical features that pose a hazard to navigation such as rocks, shoals, reefs and other features that obstruct ship passage. Bottom measurements also include collection of the nature of the bottom as it pertains to effective anchoring. Unlike oceanography, hydrography will include shore features, natural and manmade, that aid in navigation. Therefore, a hydrographic survey may include the accurate positions and representations of hills, mountains and even lights and towers that will aid in fixing a ship's position, as well as the physical aspects of the sea and seabed.
Hydrography, mostly for reasons of safety, adopted a number of conventions that have affected its portrayal of the data on nautical charts. For example, hydrographic charts are designed to portray what is safe for navigation, and therefore will usually tend to maintain least depths and occasionally de-emphasize the actual submarine topography that would be portrayed on bathymetric charts. The former are the mariner's tools to avoid accident. The latter are best representations of the actual seabed, as in a topographic map, for scientific and other purposes. Trends in hydrographic practice since c. 2003-2005 have led to a narrowing of this difference, with many more hydrographic offices maintaining "best observed" databases, and then making navigationally "safe" products as required. This has been coupled with a preference for multi-use surveys, so that the same data collected for nautical charting purposes can also be used for bathymetric portrayal.
Even though, in places, hydrographic survey data may be collected in sufficient detail to portray bottom topography in some areas, hydrographic charts only show depth information relevant for safe navigation and should not be considered as a product that accurately portrays the actual shape of the bottom. The soundings selected from the raw source depth data for placement on the nautical chart are selected for safe navigation and are biased to show predominately the shallowest depths that relate to safe navigation. For instance, if there is a deep area that can not be reached because it is surrounded by shallow water, the deep area may not be shown. The color filled areas that show different ranges of shallow water are not the equivalent of contours on a topographic map since they are often drawn seaward of the actual shallowest depth portrayed. A bathymetric chart does show marine topology accurately. Details covering the above limitations can be found in Part 1 of Bowditch's American Practical Navigator. Another concept that affects safe navigation is the sparsity of detailed depth data from high resolution sonar systems. In more remote areas, the only available depth information has been collected with lead lines. This collection method drops a weighted line to the bottom at intervals and records the depth, often from a rowboat or sail boat. There is no data between soundings or between sounding lines to guarantee that there is not a hazard such as a wreck or a coral head waiting there to ruin a sailor's day. Often, the navigation of the collecting boat does not match today's GPS navigational accuracies. The hydrographic chart will use the best data available and will caveat it's nature in a caution note or in the legend of the chart.
A hydrographic survey is quite different from a bathymetric survey in some important respects, particularly in a bias toward least depths due to the safety requirements of the former and geomorphologic descriptive requirements of the latter. Historically, this could include echosoundings being conducted under settings biased toward least depths, but in modern practice hydrographic surveys typically attempt to best measure the depths observed, with the adjustments for navigational safety being applied after the fact.
Hydrography of streams will include information on the stream bed, flows, water quality and surrounding land. Basin or interior hydrography pays special attention to rivers and potable water although if collected data is not for ship navigational uses, and is intended for scientific usage, it is more commonly called hydrology.
History
Hydrography's origin lies in the making of chart like drawings and notations made by individual mariners. These were usually the private property, even closely held secrets, of individuals who used them for commercial or military advantage. Eventually organizations, particularly navies, realized the collection of this individualized knowledge and distribution to their members gave an organizational advantage. The next step was to organize members to actively collect information. Thus were born dedicated hydrographic organizations for the collection, organization, publication and distribution of hydrography incorporated into charts and sailing directions.
Originally, hydrography was carried out by ships as they navigated into new waters. As shipping increased and the technology became more specialised and complex, hydrographic surveys started to be carried out as an exercise in their own right, and commisioning of surveys increasingly was done by governments and their hydrographic offices. However with technology becoming ever cheaper, and commercial hydrographic surveys failing to keep up with the demand for more and better data, we are seeing the development of crowd sourced hydrographic survey projects such as TeamSurv.
ORGANISATIONS - Hydrographic services in most countries are carried out by specialised hydrographic offices. The international coordination of hydrographic efforts lies with the International Hydrographic Organization.
The United Kingdom Hydrographic Office is one of the oldest and most respected hydrography organisations in the world, supplying the widest range of charts covering the globe to other countries, allied military organisations and the public. In the United States, the hydrographic charting function has been carried out since 1807 by the Office of Coast Survey of the National Oceanic and Atmospheric Administration within the U.S. Department of Commerce.
EXPLORATION GEOPHYSICS -
Exploration geophysics is the applied branch of geophysics which uses surface methods to measure the physical properties of the subsurface Earth, along with the anomalies in these properties, in order to detect or infer the presence and position of ore minerals, hydrocarbons, geothermal reservoirs, groundwater reservoirs, and other geological structures.
Exploration geophysics is the practical application of physical methods (such as seismic, gravitational, magnetic, electrical and electromagnetic) to measure the physical properties of rocks, and in particular, to detect the measurable physical differences between rocks that contain ore deposits or hydrocarbons and those without.
Exploration geophysics can be used to directly detect the target style of mineralisation, via measuring its physical properties directly. For example one may measure the density contrasts between iron ore and silicate wall rocks, or may measure the electrical conductivity contrast between conductive sulfide minerals and barren silicate minerals.
Controlled source electro-magnetic
The Controlled Source Electromagnetic (CSEM) method is an offshore geophysical technique, employing electromagnetic remote-sensing technology to indicate the presence and extent of hydrocarbon accumulations below the seabed.
The CSEM survey uses a dipole source that is towed just above the seafloor to transmit a time-varying electromagnetic field into the earth. This field is modified by the presence of subsurface resistive layers and these changes are detected and logged by an array of receivers placed on the seabed. Because hydrocarbon-bearing formations are highly resistive compared with surrounding formations, a CSEM survey can indicate the presence of oil and gas in offshore situations.
Geophysical
techniques used:
1. Seismic methods, such as reflection seismology, seismic refraction, and seismic tomography.
2.
Geodesy and gravity techniques, including gravity gradiometry.
3.
Magnetic techniques, including aeromagnetic surveys.
4.
Electrical techniques, including electrical resistivity tomography and induced polarization.
5.
Electromagnetic methods, such as magnetotellurics, ground penetrating radar and transient/time-domain
electromagnetics.
6. Borehole geophysics, also called well logging.
7. Remote sensing techniques, including hyperspectral imaging.
Uses
Exploration geophysics is also used to map the subsurface structure of a region, to elucidate the underlying structures, spatial distribution of rock units, and to detect structures such as faults, folds and intrusive rocks. This is an indirect method for assessing the likelihood of ore deposits or hydrocarbon accumulations.
Methods devised for finding mineral or hydrocarbon deposits can also be used in other areas such as monitoring environmental impact, imaging subsurface archaeological sites, ground water investigations, subsurface salinity mapping, civil engineering site investigations and interplanetary imaging.
Mineral exploration
Magnetometric surveys can be useful in defining magnetic anomalies which represent ore (direct detection), or in some cases gangue minerals associated with ore deposits (indirect or inferential detection).
The most direct method of detection of ore via magnetism involves detecting iron ore mineralisation via mapping magnetic anomalies associated with banded iron formations which usually contain magnetite in some proportion. Skarn mineralisation, which often contains magnetite, can also be detected though the ore minerals themselves would be non-magnetic. Similarly, magnetite, hematite and often pyrrhotite are common minerals associated with hydrothermal alteration, and this alteration can be detected to provide an inference that some mineralising hydrothermal event has affected the rocks.
Gravity surveying can be used to detect dense bodies of rocks within host formations of less dense wall rocks. This can be used to directly detect Mississippi Valley Type ore deposits, IOCG ore deposits, iron ore deposits, skarn deposits and salt diapirs which can form oil and gas traps.
Electromagnetic (EM) surveys can be used to detect a wide variety of base metal sulphide deposits via detection of conductivity anomalies which can be generated around sulphide bodies in the subsurface. EM surveys can also be used to detect palaeochannel-hosted uranium deposits which are associated with shallow aquifers, which often respond to EM surveys in conductive overburden. This is an indirect inferential method of detecting mineralisation.
Regional EM surveys are conducted via airborne methods, using either fixed-wing aircraft or helicopter-borne EM rigs. Surface EM methods are based mostly on Transient EM methods using surface loops with a surface receiver, or a downhole tool lowered into a borehole which transects a body of mineralisation. These methods can map out sulphide bodies within the earth in 3 dimensions, and provide information to geologists to direct further exploratory drilling on known mineralisation. Surface loop surveys are rarely used for regional exploration, however in some cases such surveys can be used with success (e.g.; SQUID surveys for nickel ore bodies).
Electric-resistance methods such as induced polarization methods can be useful for directly detecting sulfide bodies, coal and resistive rocks such as salt and carbonates.
Oil and gas
Seismic reflection techniques are the most widely used geophysical technique in hydrocarbon exploration. They are used to map the subsurface distribution of stratigraphy and its structure which can be used to delineate potential hydrocarbon accumulations. Well logging is another widely used technique as it provides necessary high resolution information about rock and fluid properties in a vertical section, although they are limited in areal extent. This limitation in areal extent is the reason why seismic reflection techniques are so popular; they provide a method for interpolating and extrapolating well log information over a much larger area.
Gravity and magnetics are also used, with considerable frequency, in oil and gas exploration. These can be used to determine the geometry and depth of covered geological structures including uplifts, subsiding basins, faults, folds, igneous intrusions and salt diapirs due to their unique density and magnetic susceptibility signatures compared to the surrounding rocks.
Remote sensing techniques, specifically hyperspectral imaging, have been used to detect hydrocarbon microseepages using the spectral signature of geochemically altered soils and vegetation.[1][2]
Magnetotellurics and Controlled source electro-magnetics can provide pseudo-direct detection of hydrocarbons by detecting resistivity changes. It can also complement seismic data when imaging below salt.
Civil engineering
Ground penetrating radar is used within civil construction and engineering for a variety of uses, including detection of utilities (buried water, gas, sewerage, electrical and telecommunication cables), mapping of soft soils and overburden for geotechnical characterization, and other similar uses.
Civil engineering can also use remote sensing information for topographical mapping, planning and environmental impact assessment. Airborne electromagnetic surveys are also used to characterize soft sediments in planning and engineering roads, dams and other structures.
Magnetotellurics has proven useful for delineating groundwater reservoirs, mapping faults around areas where hazardous substances are stored (e.g. nuclear power stations and nuclear waste storage facilities), and earthquake precursor monitoring in areas with major structures such as hydro-electric dams subject to high levels of seismic activity.
MARINE ARCHAEOLOGY
Ground magnetometric surveys can be used for detecting buried ferrous metals, useful in surveying shipwrecks, modern battlefields strewn with metal debris, and even subtle disturbances such as large-scale ancient ruins.
Sonar systems can be used to detect shipwrecks.
GEODETIC SENSING
Acoustic and near-acoustic
Sonar: passive sonar, listening for the sound made by another object (a vessel, a whale etc.); active sonar, emitting pulses of sounds and listening for echoes, used for detecting, ranging and measurements of underwater objects and terrain.
To coordinate a series of large-scale observations, most sensing systems depend on the following: platform location, what time it is, and the rotation and orientation of the sensor. High-end instruments now often use positional information from satellite navigation systems. The rotation and orientation is often provided within a degree or two with electronic compasses. Compasses can measure not just azimuth (i. e. degrees to magnetic north), but also altitude (degrees above the horizon), since the magnetic field curves into the Earth at different angles at different latitudes. More exact orientations require gyroscopic-aided orientation, periodically realigned by different methods including navigation from stars or known benchmarks.
TYPICAL
EQUIPMENT ARRAY
• DGPS. This is an advanced system which makes use of multiple satellites positioned in orbit around the earth for the determination of a position on the earth. In combination with a fixed differential transmitter in the vicinity of the work site an accuracy of about 2 cm X,Y and Z can be achieved. This is called RTK DGPS.
• Echosounder. Water depths are measured by means of an underwater echo sounding device. Depths of up to 11 km can be measured this way. Nowadays the complex multibeam echosounder is more widely used. The advantage of this instrument is that it takes multiple measurements up to 40 times per second and can cover an area on the seabed of about 4 times the water depth, producing a 3D dataset of the seabed topography.
• Compass. In order to determine an accurate heading for the positioning of sensors and general surveyheading, modern compasses are used. These devices can record heading to within an accuracy of about 0.001°. Accuracies of this magnitude are important during the laying of pipelines or the construction of tunnels.
• Underwater positioning. Since satellites can not be used for positioning underwater, we require the use of an accurate underwater acoustic positioning system. The long baseline (LBL) acoustic system consists of a chain (array) of acoustic beacons (transponders) which are installed on the seabed. Through the transmission of acoustic signals between the beacons it is possible to accurately position and track any vehicle within the array. This type of system is used regularly when high accuracy positioning is required, for example during the positioning of an underwater robot (ROV) carrying out intervention work.
• Side Scan Sonar. Side looking sonar images of the seabed and their reflections are obtained by use of this system, making it very suitable for the detection of wrecks and / or other seabed obstacles.
SENSING SOFTWARE
Remote Sensing software
Remote Sensing data is processed and analyzed with computer software, known as a remote sensing application. A large number of proprietary and open source applications exist to process remote sensing data. Remote Sensing Software packages include:
TNTmips from MicroImages,
PCI Geomatica made by PCI Geomatics, the leading remote sensing software package in Canada,
IDRISI from Clark Labs,
Image Analyst from Intergraph,
and RemoteView made by Overwatch Textron Systems.
Dragon/ips is one of the oldest remote sensing packages still available, and is in some cases free.
Open source remote sensing software includes:
OSSIM,
Opticks (software),
Orfeo toolbox
Others mixing remote sensing and GIS capabilities are: GRASS GIS, ILWIS, QGIS, and TerraLook.
According to an NOAA Sponsored Research by Global Marketing Insights, Inc. the most used applications among Asian academic groups involved in remote sensing are as follows: ERDAS 36% (ERDAS IMAGINE 25% & ERMapper 11%); ESRI 30%; ITT Visual Information Solutions ENVI 17%; MapInfo 17%.
Among Western Academic respondents as follows: ESRI 39%, ERDAS IMAGINE 27%, MapInfo 9%, AutoDesk 7%, ITT Visual Information Solutions ENVI 17%.
THE
SEARCH FOR CRUDE OIL RESERVOIRS
Three conditions must be present for oil reservoirs to form: a source rock rich in hydrocarbon material buried deep enough for subterranean heat to cook it into oil; a porous and permeable reservoir rock for it to accumulate in; and a cap rock (seal) or other mechanism that prevents it from escaping to the surface. Within these reservoirs, fluids will typically organize themselves like a three-layer cake with a layer of water below the oil layer and a layer of gas above it, although the different layers vary in size between reservoirs.
This set of circumstances may be identified during survey with the proper
sensors and software.
|
